A Brief Introduction to Core Web Vitals
Website optimization is often compared to building a house - you need a solid foundation before adding decorative elements. In the digital landscape, that foundation is page speed. Before diving into sophisticated user experience improvements or brand aesthetics, ensuring your website loads quickly and performs smoothly is crucial. This is where Core Web Vitals come into play.
While it might be tempting to focus on visual design or complex functionality first, slow-loading pages can drive visitors away before they even experience your carefully crafted content. Research shows that 53% of mobile users abandon sites that take longer than three seconds to load.
By prioritizing page speed and meeting Core Web Vitals benchmarks, you create the essential groundwork for all other optimization efforts. Only after achieving satisfactory performance metrics should you shift your focus to secondary aspects like user testing, brand asset design, or advanced functionality.


What Are Core Web Vitals?
Addressing performance can feel overwhelming with the amount of tools and metrics available nowadays. However, there's no need to get lost in this maze of options. Instead, focusing on the essentials can give you a thorough understanding with minimal effort.
When visitors land on your site, they expect it to load quickly. How can we measure load times? We can do it by using straightforward measurements of key aspects of your page’s performance.
One of the big names in the world of page speed, Google, uses three questions that allow them to assess website’s speed and give it a score:
- How long does it take for the page to appear on the screen?
- How much time does it pass before the website reacts to the user's actions?
- Are visible elements moving around the page when it loads or remaining stable?
The answers Google collects are then put into metrics:
- Largest Contentful Paint (LCP) It’s time it takes for your main content to appear on the screen

↑ That's how a Largest Contentful Paint looks on an optimized and unoptimized website.
- First Input Delay (FID) or Interaction to Next Paint (INP) It’s looking at how much time does it pass before the website reacts to the user’s input, like clicks or typing.
↑ First Input Delay on an unptimized and optimized website.
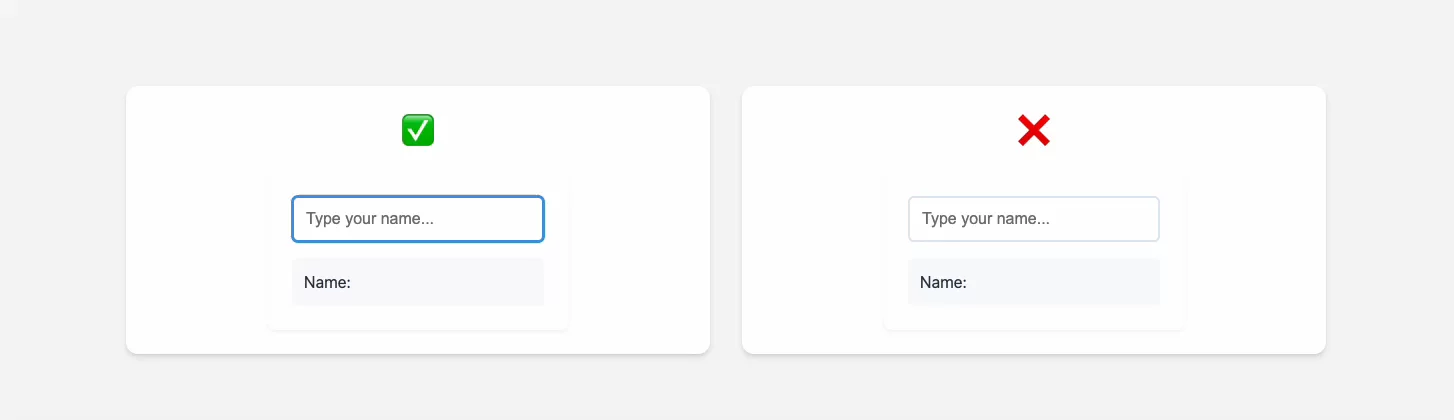
- Cumulative Layout Shift (CLS) This measurement tracks any unanticipated movements of on-screen elements as the page loads, ensuring that the visual layout remains steady.

↑ Cumulative Layout Shift on an optimized and unoptimized website.
In March 2024, Google introduced another metric to assess your page speed: Interaction to Next Paint (INP). This metric is an evolution of the earlier First Input Delay (FID), reflecting ongoing improvements in performance measurement. Unlike FID, which focuses on the delay between the first interaction and when the browser begins processing it, INP provides a more comprehensive view.
INP measures the delay between any interaction — such as clicking your mouse, tapping the touchpad, or typing — and when the result of that interaction is visible to the user. This shift from focusing solely on the first interaction to all interactions and what user actually sees as a result of their actions provides a fuller picture and shows how user experience is prioritized.
Let’s see how to put this into practice.
How to Measure Your Site’s Performance?
Now let’s talk about your site. To see how your website measures up to the key performance questions, Google’s free tool, PageSpeed Insights, is often sufficient, especially when you’re just starting out. The tool stands out because it provides data based on real user experiences, rather than relying on theoretical lab scores.

↑ That's how a Page Speed Insights should look like.
What does it mean? Many tools available out there measure performance in simulated environments. Google’s tool, besides ability to show simulated data, reflects how actual users interact with your site across a variety of devices and network conditions. This makes it a practical first choice because it allows you to see the experience of everyday users.
Lab scores can be misleading. A page might score well in a lab setting but perform poorly for users with slower internet connections or older devices.
It’s even tempting to jump into conclusions based on your own testing if your website seems to do well on your device. This is the pitfall we’re trying to avoid.
That said, lab scores from tools like GTmetrix, Pingdom or WebPageTest offer valuable insights with their own algorithms and details. They’re worth exploring if you’re interested in deeper analysis. For simplicity, though, starting with PageSpeed Insights is a good approach.

↑ GTMetrix will help you work on the Core Web Vitals of your website.
Enter your page’s address and hit “Analyze” to see the results. Also, remember that your homepage is not the only page where visitors start their journey. If you’re on Shopify or other eCommerce platform, be sure to measure at least five of your product pages and five of your product listing pages. This way you can see the score across different page types.
Understanding Your Core Web Vitals Score
When using PageSpeed Insights, it’s easiest to interpret your results relying on the Core Web Vitals Assessment at the top of the result page.
If your score reads “Passed,” it means that at least 75% of your users are experiencing:
- satisfactory loading speeds,
- responsive page interactions, and
- stable visual elements.
This means that your performance aligns with industry standards and provides a good user experience for the majority, across all core web vitals metrics.
On the other hand, if the score reads “Failed,” it highlights areas needing improvement. This suggests that visitors might be encountering issues affecting their experience.
If PageSpeed Insights doesn’t display your score, it likely means there haven’t been enough samples collected by Google yet. Not all visits are recorded and no score available is especially common for new websites. You might need to check back in a few weeks if the data was collected yet. In the meantime, you can refer to lab score part or use other tools like WebPageTest, which measures your site’s speed without requiring the data collection that takes time.
Remember to treat your performance score as a general guideline rather than a definitive measure. If you didn’t pass the test it doesn’t necessarily mean your site is unusable. Take a look at the visual representation of your score. Determine whether the issues are widespread or perhaps if only certain aspects or only some of the pages are falling short.
How to Optimize Core Web Vitals?
If your site didn’t pass the test, there are some quick fixes you can take to address common performance issues without requiring extensive technical knowledge.
Many performance problems stem from third-party plugins and analytics scripts. These can significantly impact your site’s speed, particularly if they are not well optimised.
Review and remove any plugins or third-party scripts from your website that you no longer use. It’s not uncommon to find outdated tools that were forgotten but still affect your page speed. Ensuring that all third-party integrations are up-to-date and necessary can make a big difference.
One useful feature of WebPageTest is its ability to block these plugins or scripts to see how their removal affects your performance score.
Another frequent issue is unoptimised images. Large, uncompressed images can significantly slow down your site. Use image compression tools to reduce file sizes and ensure that images are properly sized. Displaying large assets often doesn’t make visual difference, but it takes a lot of time to send them over the network.
Remember that Core Web Vitals real user data reflects the last 28 days of performance. Check back periodically to track improvements. If problems persist, consulting a developer might be necessary to address more complex issues.
What to Optimize If you Passed the Core Web Vitals Test?
There’s a part of the report with the list of recommended fixes even if you passed the Core Web Vitals test. While it's great to be ambitious about enhancing your site, consider a few key points.
Like many tools, PageSpeed Insights is useful but not perfect. It covers a broad range of users but may not account for every scenario. A perfect score of 100 doesn’t necessarily mean there’s nothing more to improve. Keep in mind that this part is a lab score, so take it with a grain of salt.
There are often several areas to focus on before aiming to polish a score. Here are some priorities to consider:
- User Testing: Gather feedback from real users to pinpoint areas for improvement. Asking 10 or 20 people to use your site for a few minutes and sharing their thoughts can reveal valuable insights. Simple, yet many businesses overlook this step.
- Brand Image and Design: Investing in higher-quality assets and design improvements can greatly impact user satisfaction. Sometimes, small changes can make a big difference.
- Simplifying the User Journey: Analyse how users navigate from entering your site to completing actions like purchasing a product or signing up for a newsletter. Making these processes smoother and more intuitive can enhance the overall experience and boost conversions at the same time.
- Removing Distractions: Eliminate unnecessary elements that may detract from the user experience. Streamlining your site can help users focus on what matters most.
This approach shows how various factors, beyond just speed, impact online business success. If you’ve passed the test, explore these other areas for improvement that might not show up in performance metrics but are crucial for delivering a good user experience.
Apply a Balanced Approach When Optimizing Your Site
Website performance is crucial, especially in eCommerce, but it should be part of a balanced approach that prioritises user experience without overshadowing other business needs. Begin by focusing on essential performance metrics like load time, interactivity, and visual stability. Tools like Google PageSpeed Insights are a good starting point, offering practical insights based on real user experiences.
If your site scores well, consider areas for improvement beyond just speed, such as user feedback, design enhancements, and simplifying user journeys. If your site fails the performance test, start with addressing common issues like unoptimized images and getting rid of outdated third-party plugins you don’t use.
Remember, achieving a perfect score isn't always practical. Start with achievable improvements and avoid getting bogged down by the pursuit of a perfect score which could be time-consuming and expensive. Prioritize changes that enhance user experience while managing your resources effectively.